15 Jun The Pan-European Thermal Atlas (Peta) released!
The Pan-European Thermal Atlas (Peta) was developed within the Heat Roadmap Europe project series to map the heat sector and the potential for district heating in European countries. The mapping team improved Peta and extended it to incorporate the 27 EU member states plus the United Kingdom. Seeing benefits in mapping disaggregated energy efficiency potentials of different sectors, Peta is being developed into a cross-sectoral mapping platform. The first version of Peta 5 (with current year layers) is online now. It is supplemented by the sEEnergies OpenDataHub for data documentation and download.
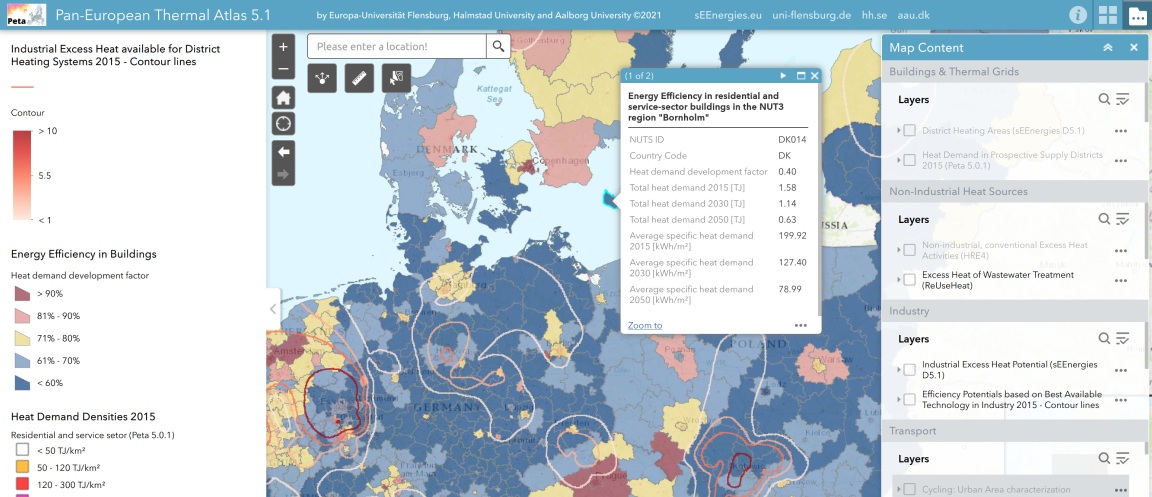
The interactive atlas shows the current heat demand distribution and the investment costs in new heating grid infrastructure. Moreover, it comprises a summary of energy efficiency potentials in buildings under assumptions of population and socio-economic development by NUTS3 region. For 1,608 energy-intensive industrial sites, energy efficiency potentials have been quantified as on-site energy savings based on the currently best available technologies (BAT). Off-site excess heat recovery in district heating systems may supply residential and service sector buildings in current district heating areas within a maximum 10 km distance. The results have been turned into geographical representations in form of the Pan-European energy saving surface and excess heat recovery surface, both with contour lines.

Additional layers display heat sources like geothermal heat, non-industrial conventional excess heat activities and excess heat of wastewater treatment. The transportation sector is represented by e-road scenario layers and the characterization of Urban Areas for cycling potentials.
The Peta mapping team will extend the atlas with new layers as the project proceeds. The map is useful for researchers studying the energy efficiency potentials in the EU, policy makers and others and can be applied to map future scenarios and visualize situations in different-sized urban areas across Europe.
By including cross-sectoral potentials in an easily accessible mapping platform, Peta 5 aims at providing required information to researchers and policy makers at hitherto unprecedented scope, scale, and resolution.
More information on Peta 5 and its datasets, developed by the mapping team located at Europa-Universität Flensburg and Halmstad University, supported by project partners at Aalborg University and Utrecht University, can be found here:
- in Peta 5
- on the OpenDataHub, and
- in the sEEnergies D5.3 report “Online web map application and 1st set of map layers”
Key words: Peta, energy efficiency mapping, heat demand density map
Contact information (main author): Bernd Möller, Europa-Universität Flensburg: bernd.moeller@uni-flensburg.de