22 Jun The costs of future district heating grids
Future district heating will have to bear energy efficiency in mind. As energy efficiency in buildings progresses, areas with lower heat demands must be supplied with increased shares of renewable energy and excess heat. Therefore, the purpose of the present work is to map future heat demands throughout Europe and calculate the costs of future infrastructure investments along with opportunities for sustainable heat supply.
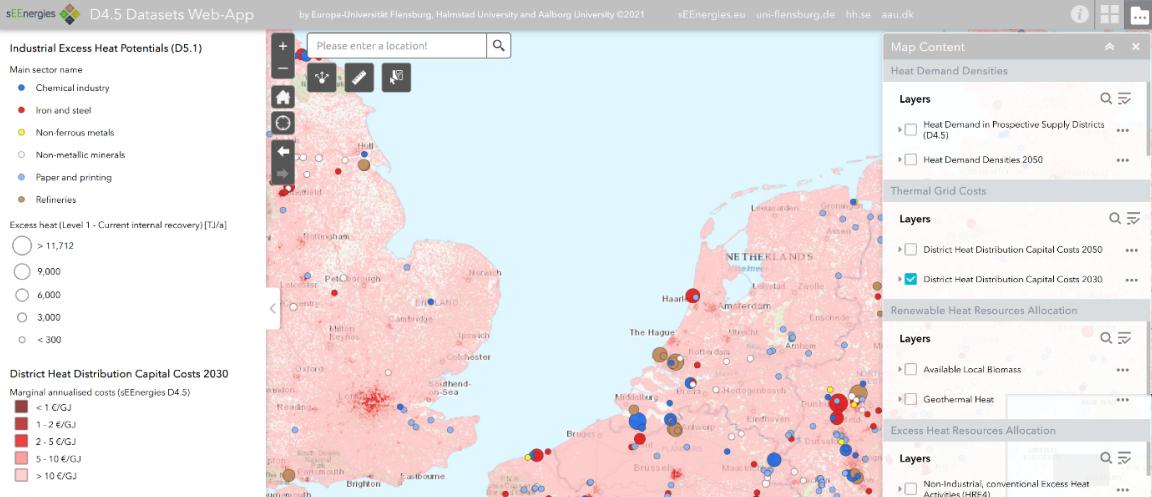
After having mapped the current year (Peta 5.1), the sEEnergies mapping team started to map the future in 2030 and 2050: Everything started with a population forecast on a hectare level. It is together with the national heat demands modelled in sEEnergies for 2030 and 2050 the main input for determining how the heat is distributed in every hectare of the European Union. The “District heat distribution capital cost” (DHDCC) method, which allows to estimate the cost of district heating pipes in areas without district heating, was improved resulting in the first investment cost maps for district heating systems for 2030 and 2050.
A unique and simple population forecast has been based on the past population developments at the local level, that are adjusted to national and regional population forecasts. The method can estimate the population on a hectare level in already populated areas but also in nearby areas that are likely to be inhabited in the future. National heat demands are then distributed using population data to calculate the heat demand in each hectare of Europe.

Data on the cost of installing district heating pipes in the ground for different countries were collected and improved the method to estimate the cost of the pipe network (the “DHDCC”), which had been developed in the Heat Roadmap Europe (HRE4) project. In addition, district heating system data of the Danish city of Odense were used to verify and improve the model, concretely, the necessary pipe length in different urban and suburban areas. Notably, these investment cost estimates now include both distribution (the main pipe network) and service pipes (pipe connections from the main network to each building).
City centres and their surrounding areas have been grouped into the so-called Prospective Supply Districts (PSDs). Later, these Prospective Supply Districts have been classified by the availability of renewable heat and excess heat sources. The assignment of industrial excess heat to the Prospective Supply Districts considers for 2030 and 2050 different temperatures at which the excess heat may be available and different accessible amounts of excess heat due to the increasing internal heat recovery at the factories.
The map showing the developed datasets (heat demands, infrastructure costs, classified Prospective Supply Districts) is useful for researchers studying the energy efficiency potentials and the future energy system in the EU on the one hand and, on the other hand for policy makers and the public in general. More information on these datasets, developed by the team located at the Europa-Universität Flensburg and Halmstad University can be found
- On the D4.5 datasets web map and
- in sEEnergies D4.5 report.
Key words: hectare grid population forecast, future heat demand density map, district heat distribution capital costs, effective width, heat resources allocation
Contact information (main author): Bernd Möller, Europa-Universität Flensburg: bernd.moeller@uni-flensburg.de

